Kubernetes Dashboard
Kubernetes Dashboard
The Kubernetes Dashboard is a web-based UI for managing and troubleshooting Kubernetes clusters.
- View workloads, Pods, Deployments, and other resources
- Explore resources across namespaces
- Manage Services, Nodes, and Storage
- Display usage metrics (requires Heapster or similar monitoring tools)
- Secure access via HTTPS and Bearer tokens
- Granular access control through RBAC
The dashboard runs in a Pod and includes:
- A REST endpoint with SSL and authentication
- Metrics add-ons like Heapster or InfluxDB for resource usage tracking
To access the dashboard from your terminal, use:
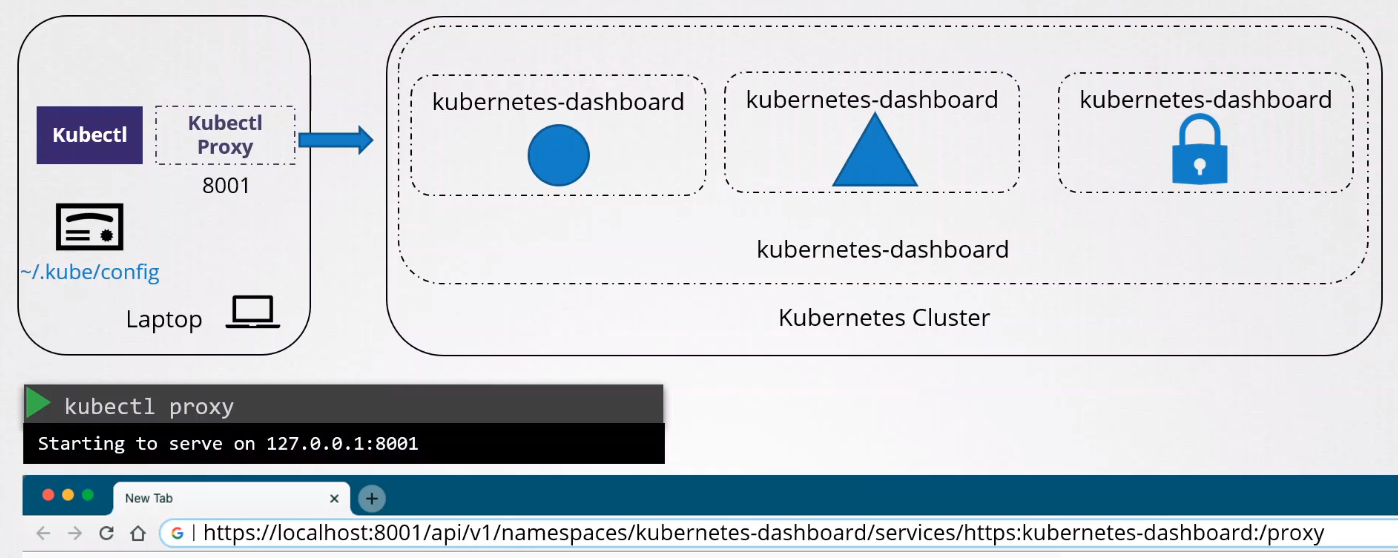
kubectl proxy
For more information, please see official Kubernetes Dashboard Github page.
Access to the Kubernetes Dashboard
By default, the Kubernetes Dashboard is exposed via ClusterIP, making it accessible only within the cluster. To access it externally:
-
Use
kubectl proxyand port forwarding. -
From a laptop or external device, launch a proxy for secure access.
Changing Service Types
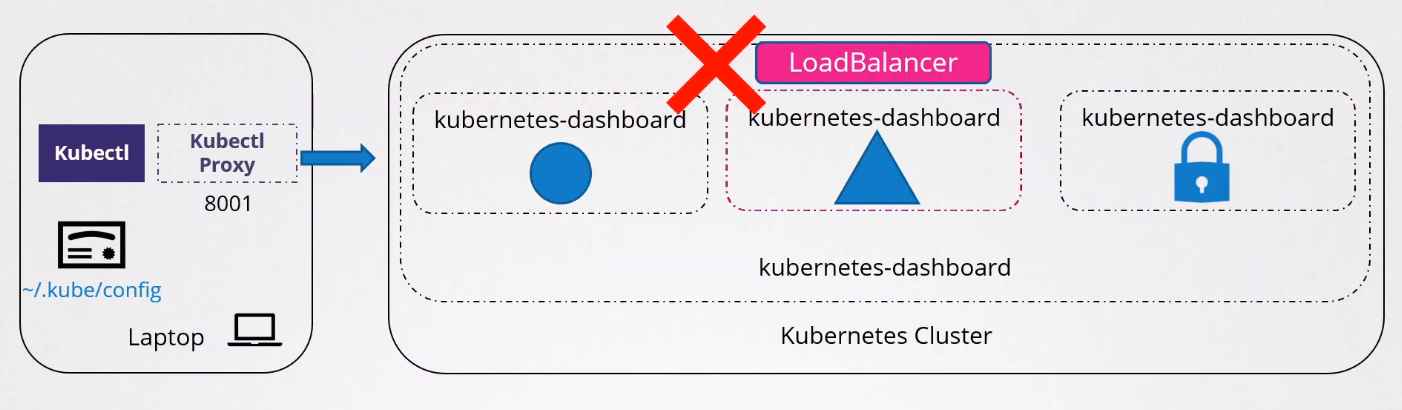
LoadBalancer (Not Recommended)
Exposing the dashboard via LoadBalancer makes it accessible outside the cluster but poses security risks.
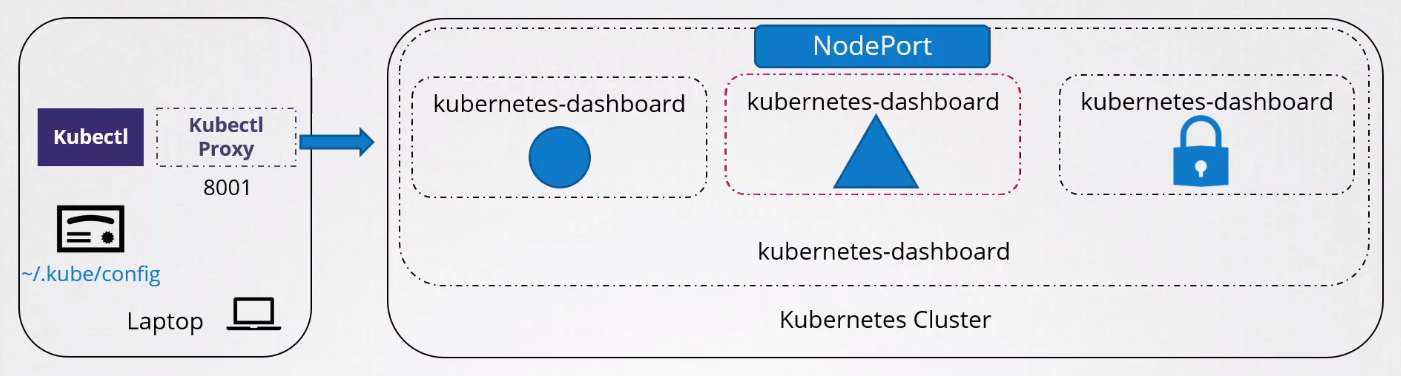
NodePort
This exposes the Kubernetes Dashboard to a port in the nodes. This is a viable solution if you are sure that your cluster is secured.
Auth Proxy
Configure an authentication proxy to validate requests and securely route traffic to the dashboard. For more information, please see Oauth2 Proxy.
Logging In
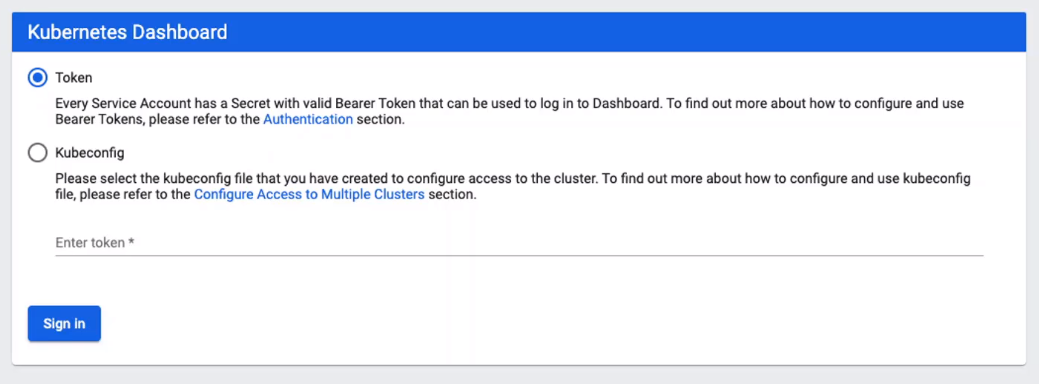
When we access the Kubernetes Dashboard, we are asked to provide a token or kubeconfig file. To provide the token, we must first create a user and then provide it role-based permissions.
For more information, please see the official Kubernetes Dashboard Github page.