Relevant Statistics
Updated Mar 03, 2023 ·
Overview
When comparing data, we can choose between different ways to express changes or patterns. Depending on the question, we can use either absolute numbers or growth percentages to represent changes.
-
Absolute Change
- Used when comparing a single variable.
- Shows the total difference (e.g., 3,000 more units sold).
-
Relative Change
- Useful when comparing several variables.
- Shows percentage growth (e.g., 10% more units sold).
- Helps compare variables of different scales (e.g., sales in thousands vs. millions).
Proportional Changes
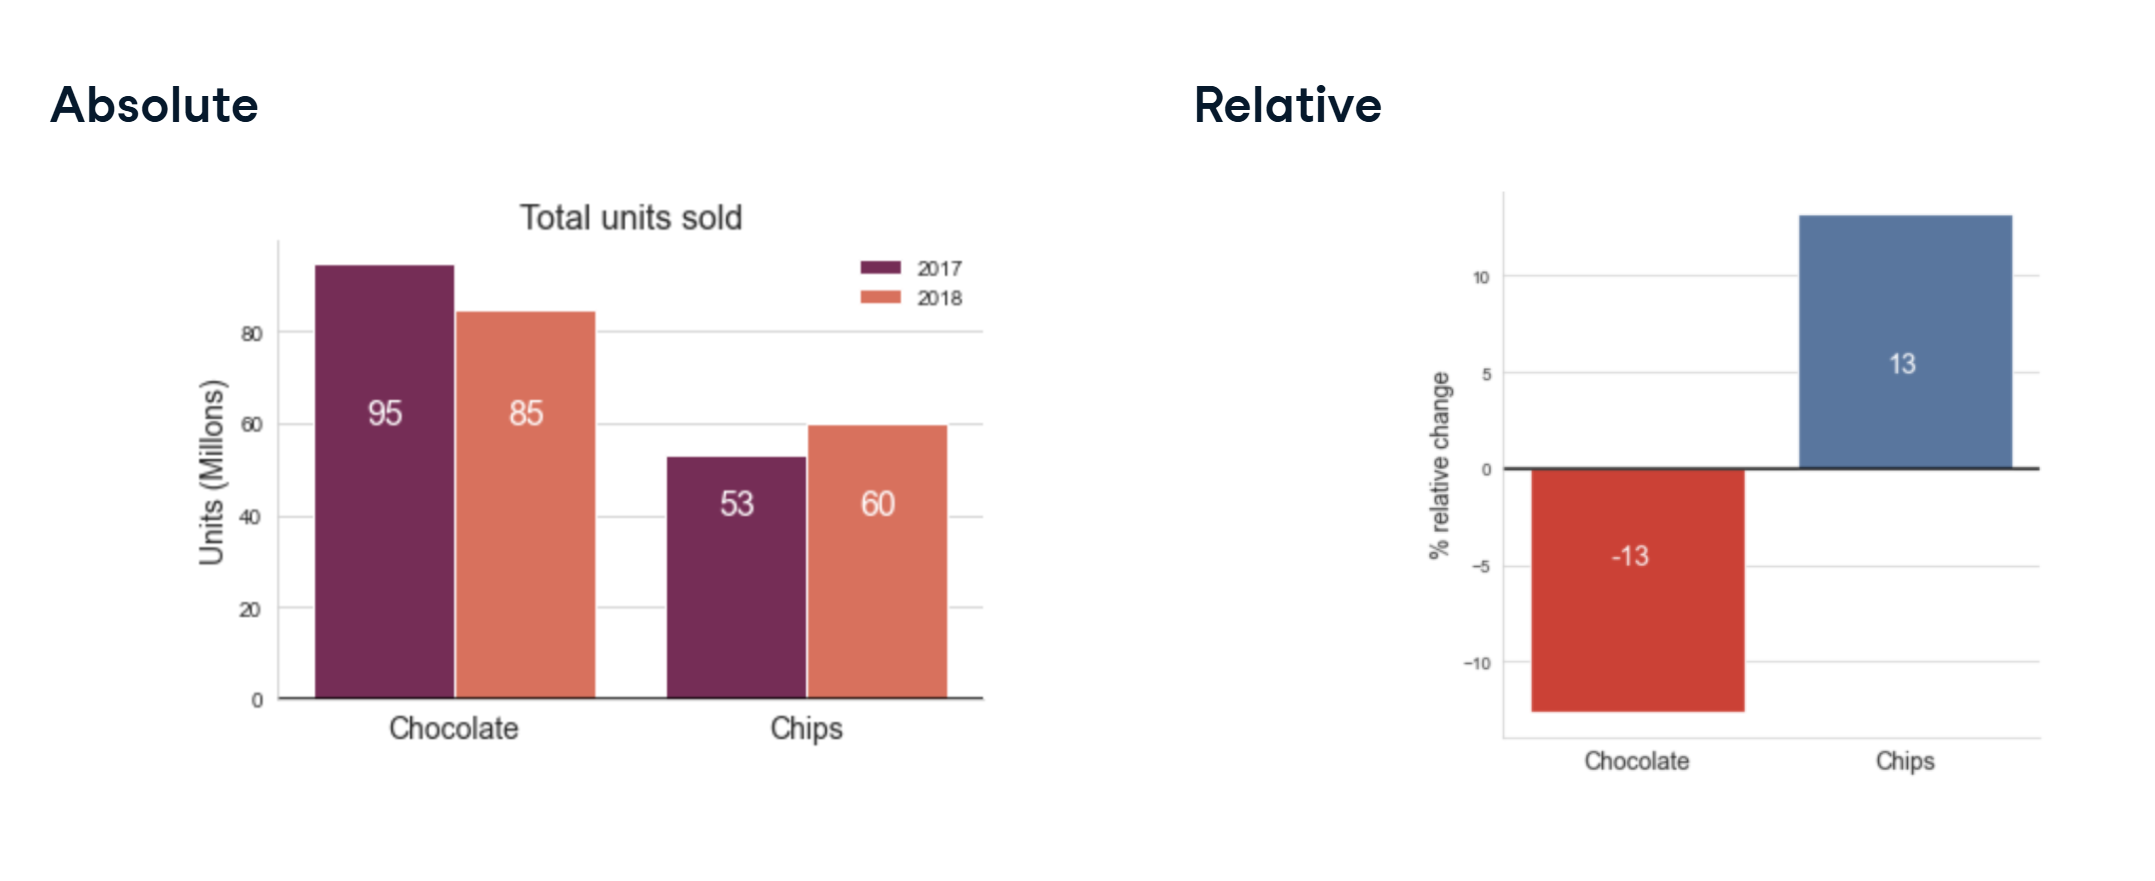
Sometimes, we want to look at how the proportion of sales changed between years.
Proportional Comparison
- Comparing the percentage change in sales helps highlight shifts.
- Example: When one product grows while another decreases.
- Shows meaningful changes in volume and helps compare product sales.
Ratios
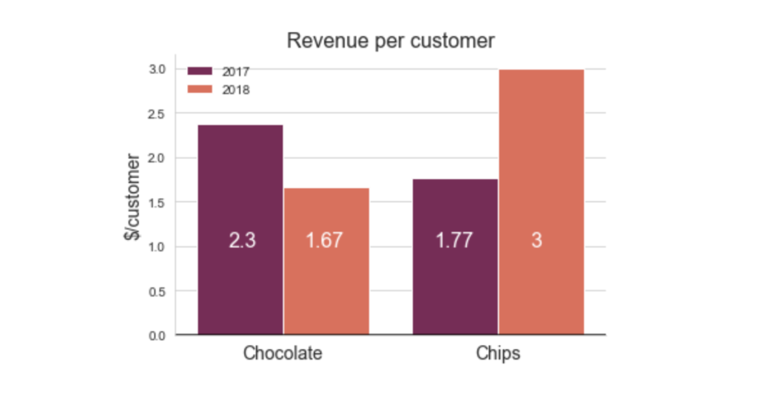
A ratio is useful for comparing two variables, particularly when the data has different scales.
- A ratio compares two numbers as a quotient (e.g., revenue per customer).
- Helps normalize data for better comparisons
- Example: Comparing sales across different products.
Aggregates
Aggregates summarize data into a single representative value.
-
Total or Count
- Simple metrics like total sales or campaign duration.
- Provides an overview.
-
Mean
- The average number can represent trends.
- Easy to calculate but can be misleading if there are outliers.
- Example: Average chocolates or chips sold per year.
-
Median
- The middle value in a dataset.
- More reliable when there are extreme values or outliers.
- Example: In 2019, the US average wage was $51,916, but the median was $34,248, showing the real distribution.
P-Value
In statistics, p-values help show how significant a result is.
- A p-value less than 0.05 usually means the result is significant
- Lower p-values mean stronger evidence against randomness
- P-values do not prove the result is true, only that it is unlikely due to chance