Create a Monitoring Dashboard
Overview
In this lab, we will create an Azure Dashboard and add metrics from a Storage account and Application Insights to monitor resource health in one place.
Creating the Dashboard
-
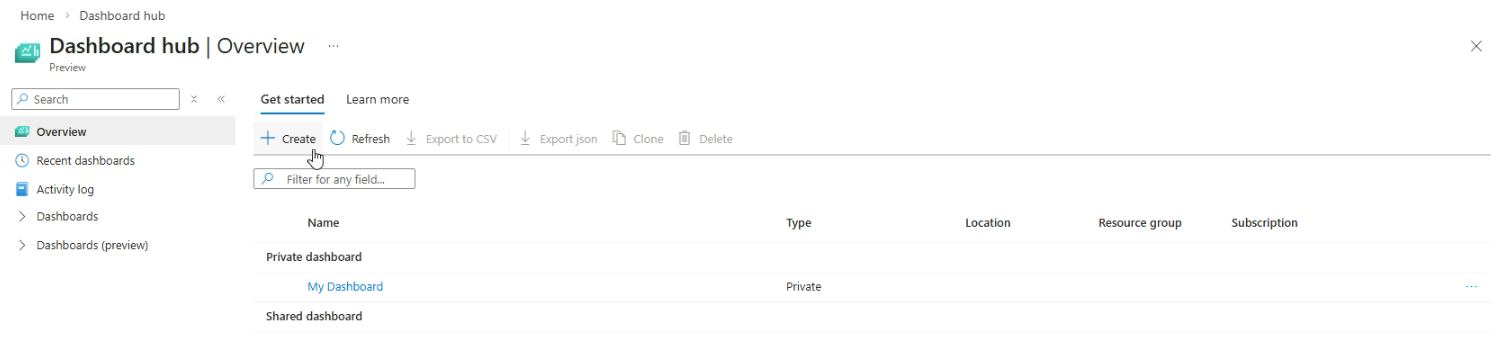
From the Azure Portal menu, navigate to Dashboard hub.
Create a new custom dashboard named "Resource Monitoring Dashboard".
-
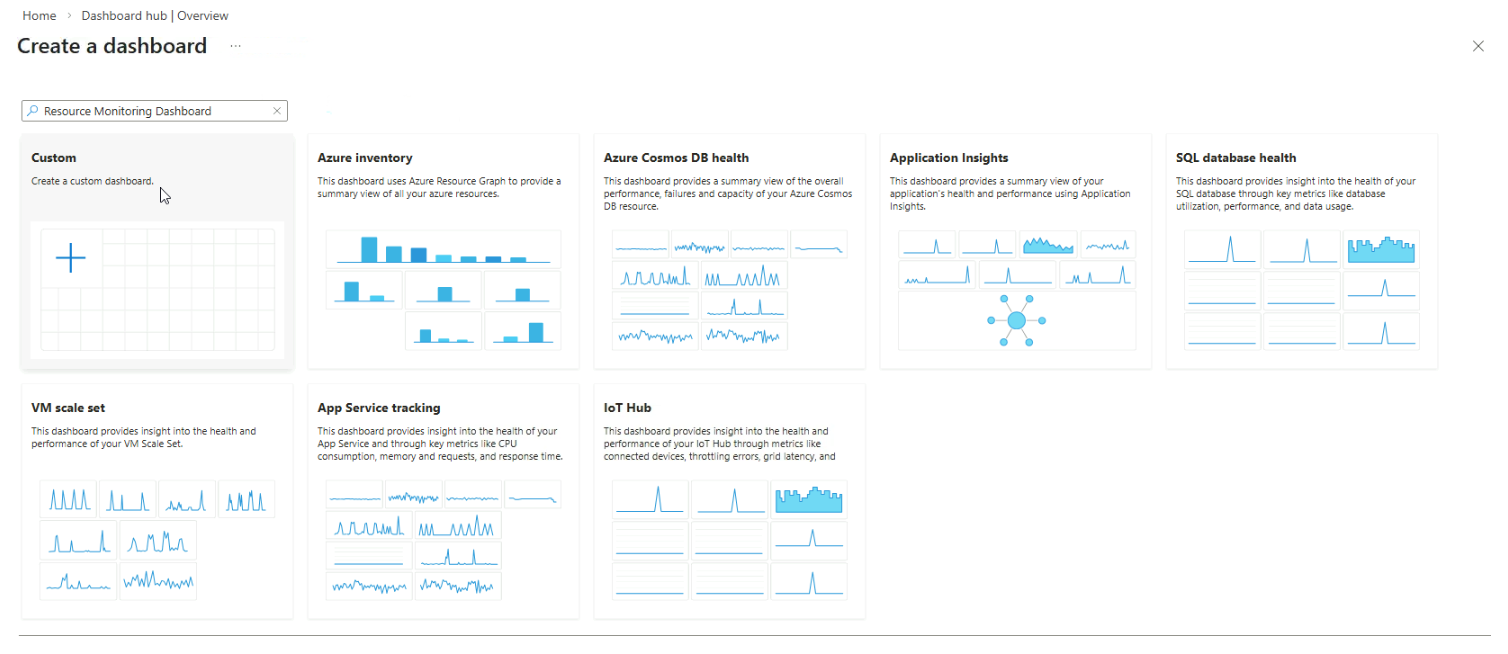
Select Custom to create a custom dashboard.
-
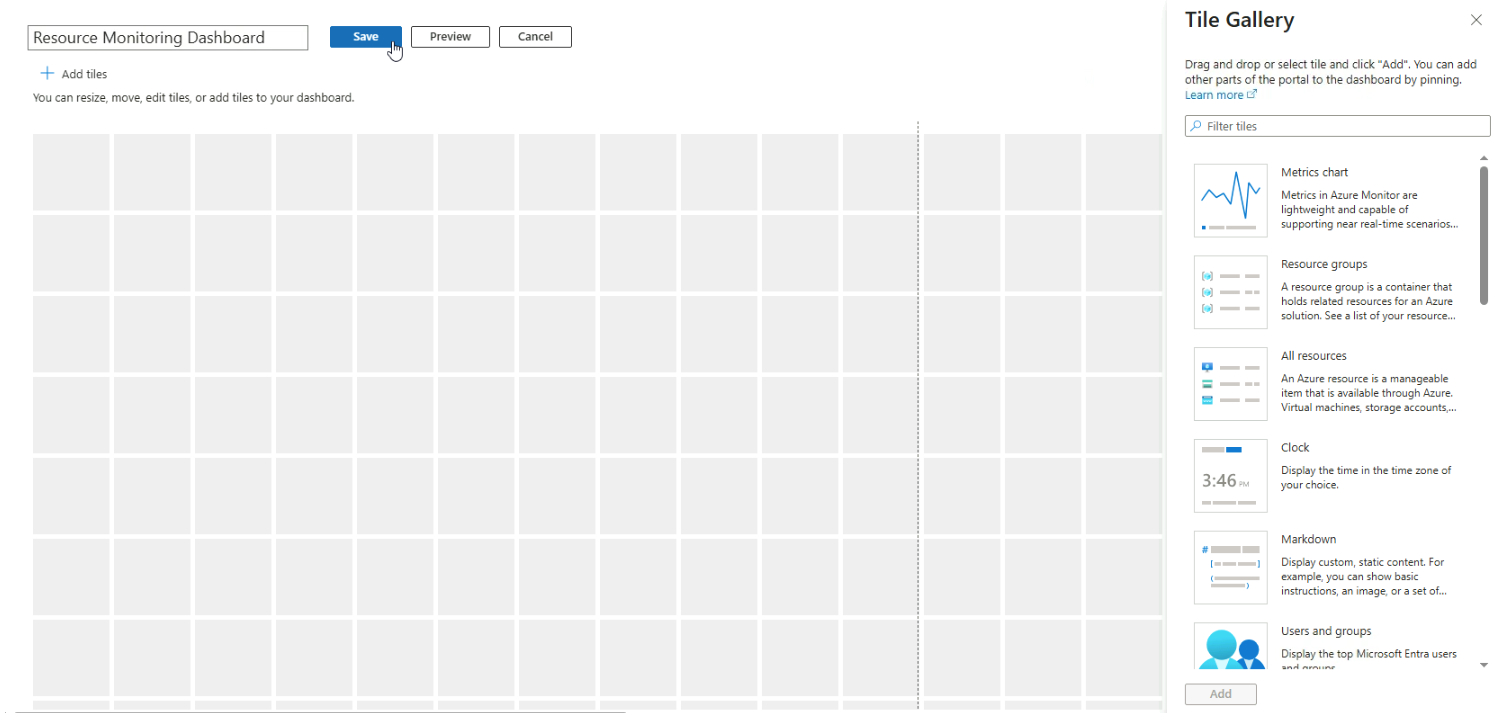
Provide a name, such as "Resource Monitoring Dashboard", and click Save.
Note: If the Save button does not appear, close the Tile Gallery and try again.
Storage Account Metrics
-
Go to Storage account ➔ select your storage account ➔ Metrics.
Display the "Transactions" metric.
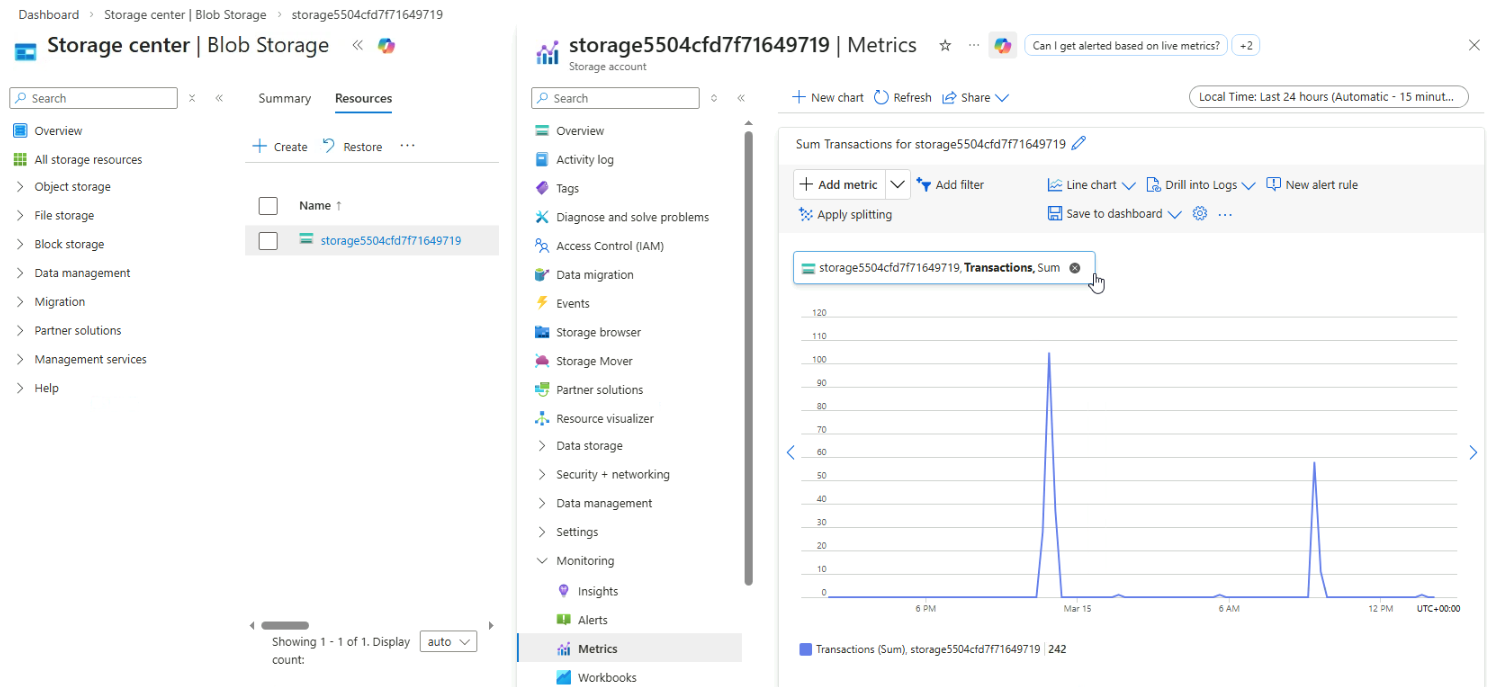
Note: I've already created a storage account prior to this lab. For more information, please see Create an Azure storage account
-
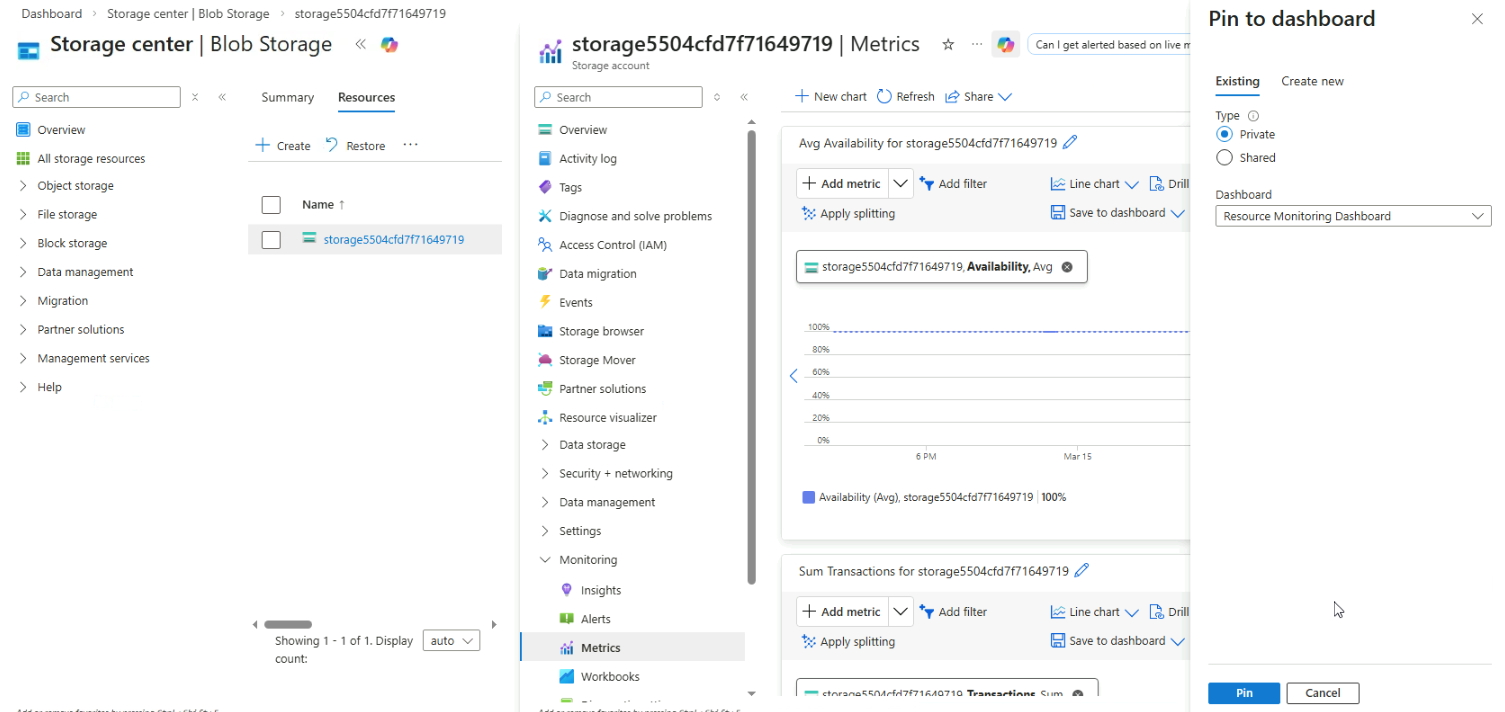
Click Save to dashboard ➔ Pin to dashboard
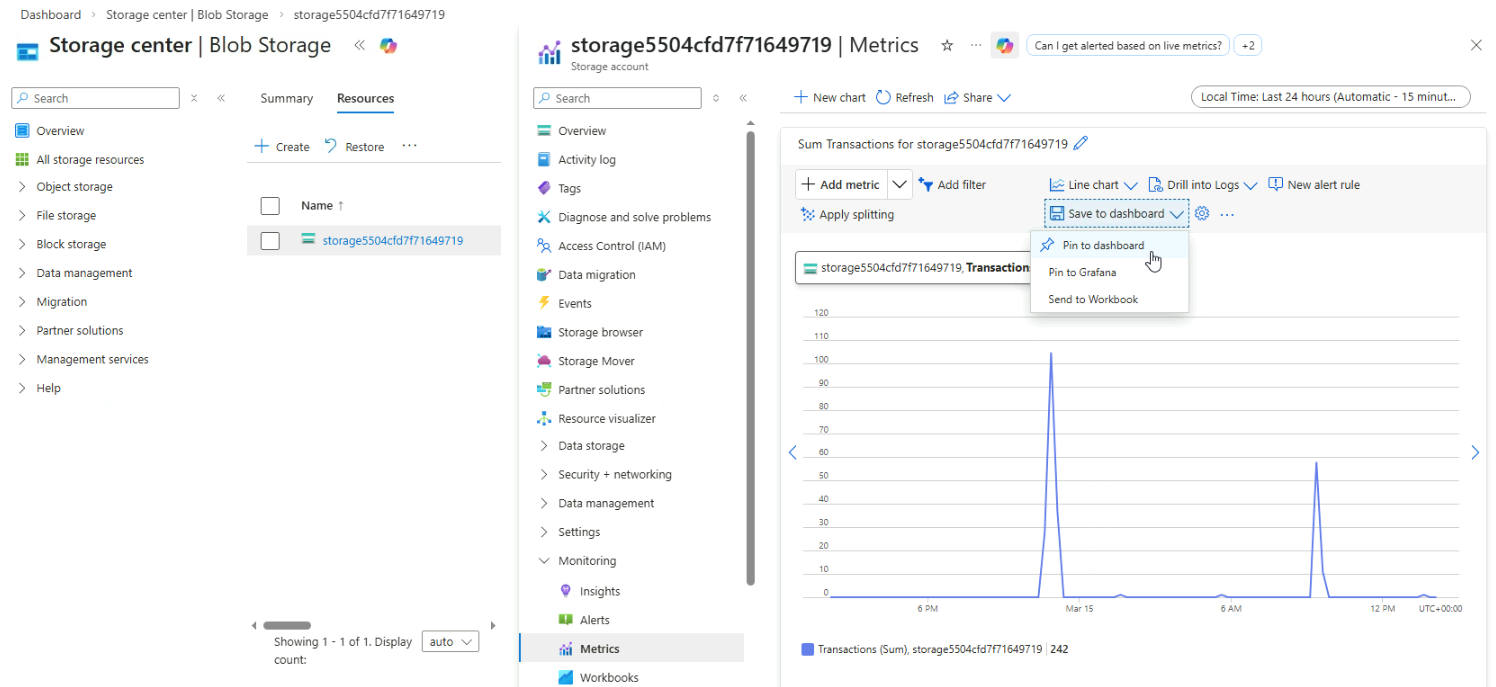
-
Select your dashboard and ensure it is set to private, then click Pin.
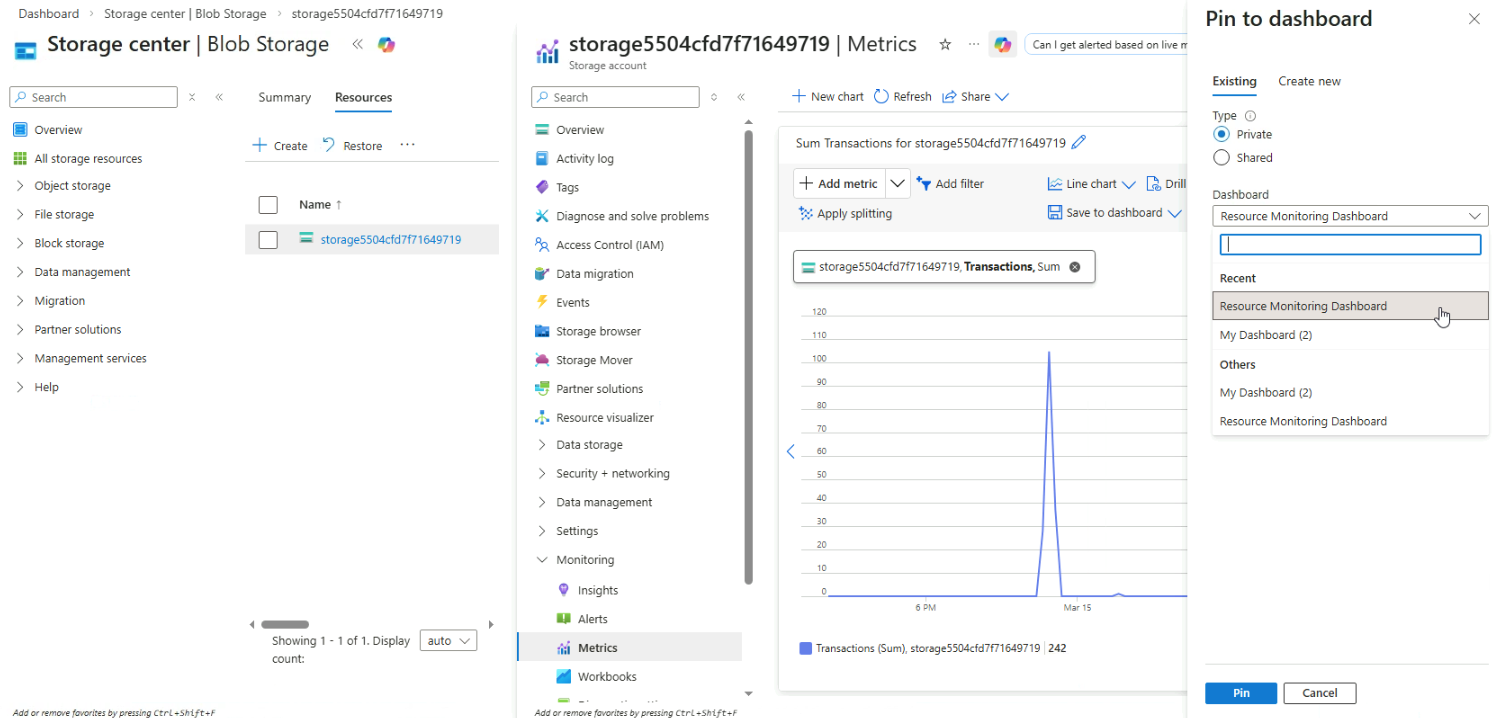
-
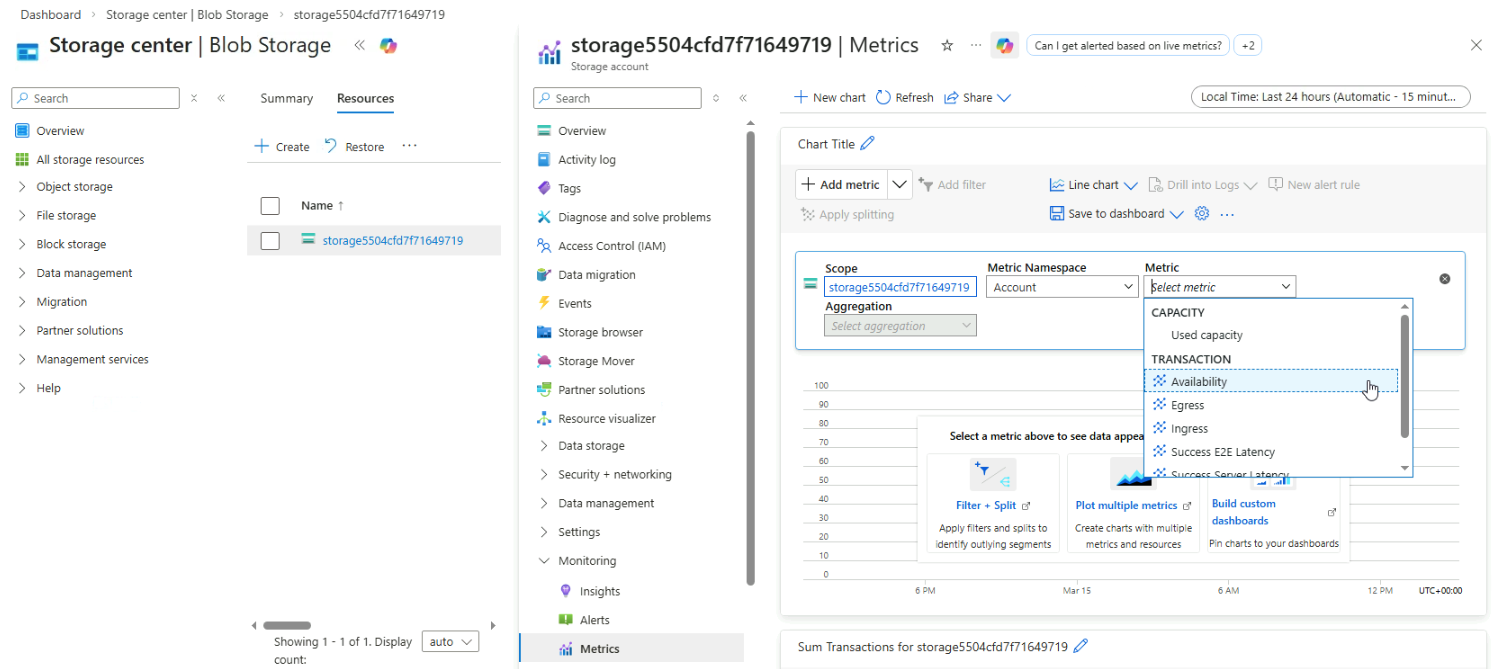
Create another chart to track storage availability.
In Metrics Explorer ➔ New chart
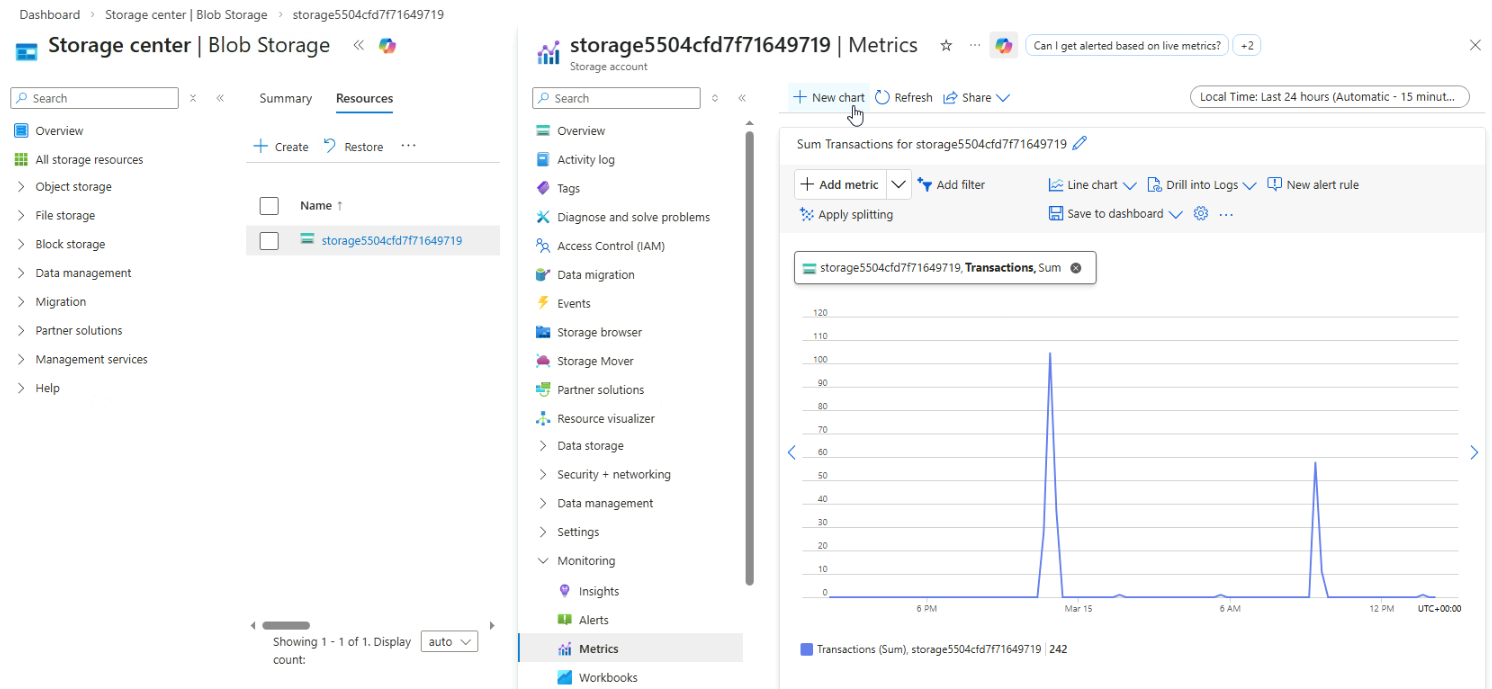
-
Select the Availability metric.
-
Pin the chart to the Resource Monitoring Dashboard.
App Service Metrics
-
Create an App Service with Application Insights
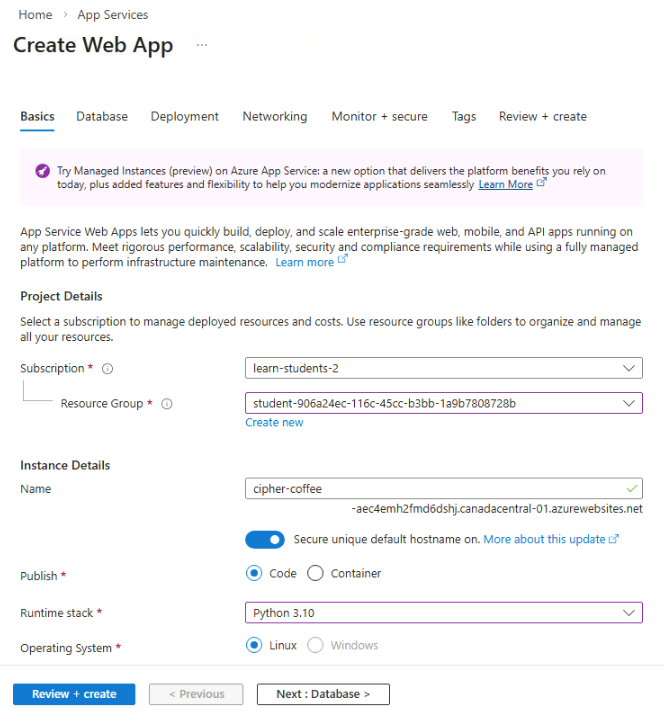
Navigate to App Services and click Create

-
Fill in the required details for your App Service.
-
Enable Application Insights during deployment.
- Go to the Monitoring tab
- Enable Application Insights
- Click Review + create and then Create
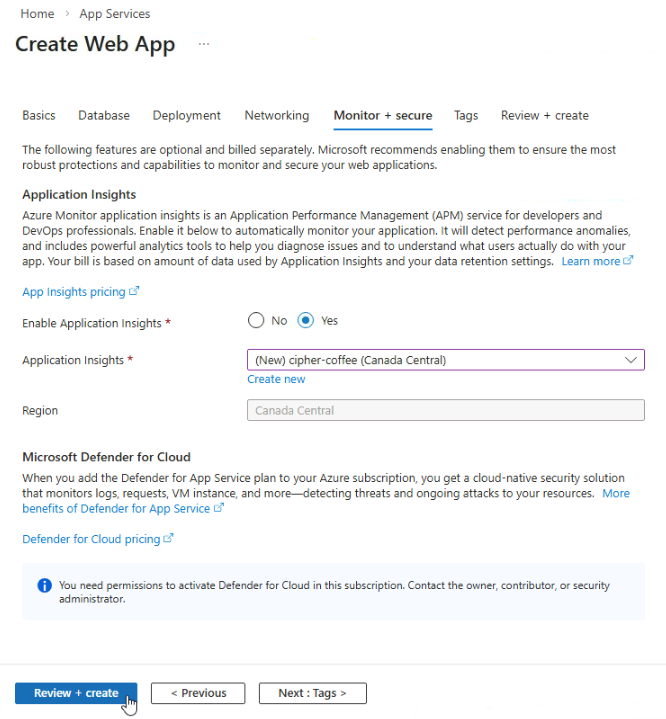
Azure will create or connect an Application Insights resource automatically.
-
Open a web browser and navigate to your deployed web application.
In the example below,
<appname>represents your App Service name.https://<appname>.azurewebsites.netRefresh the page 10–20 times.
Each refresh generates request telemetry events that Application Insights will collect and analyze.
Application Insights Metrics
-
Go to Application Insights and access your resource.

-
Pin a chart to your dashboard by clicking the pin icon.
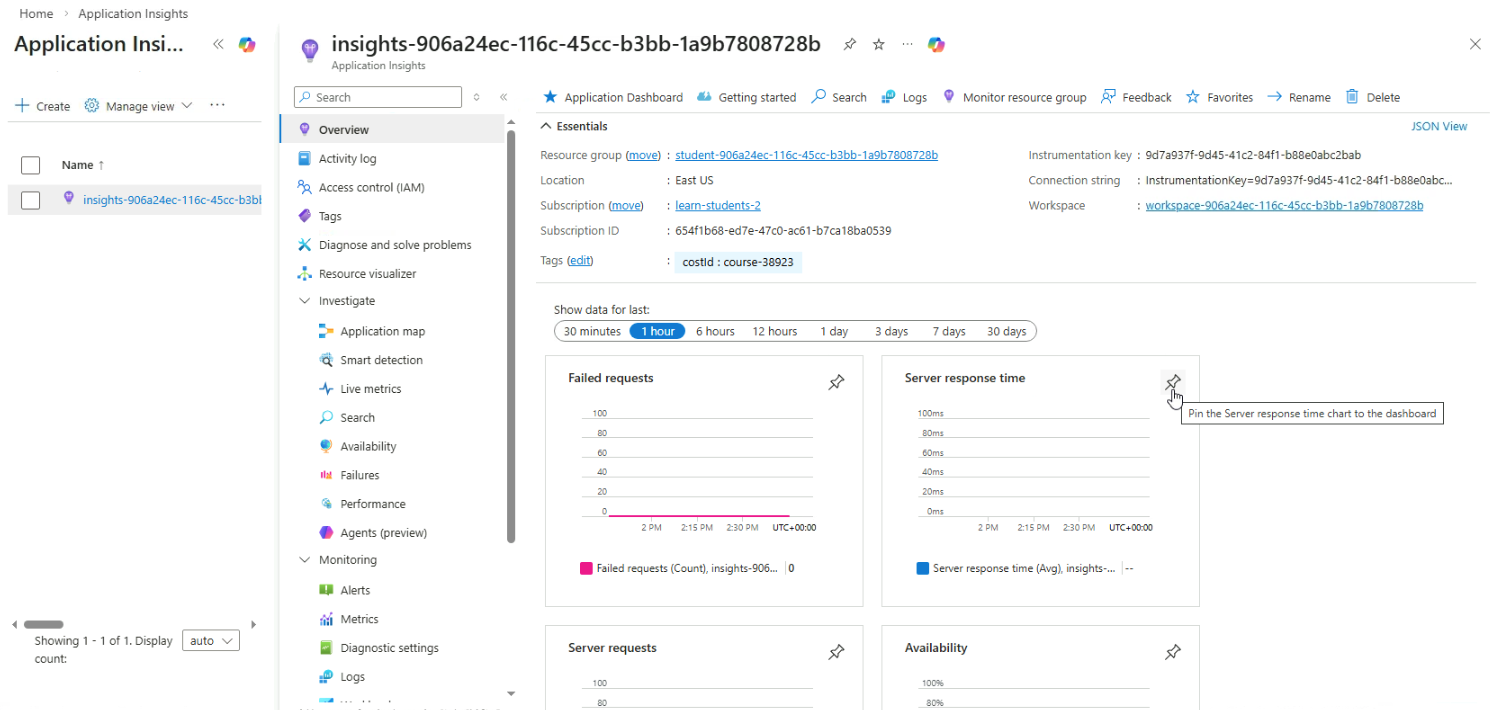
-
Select your dashboard and click Pin.
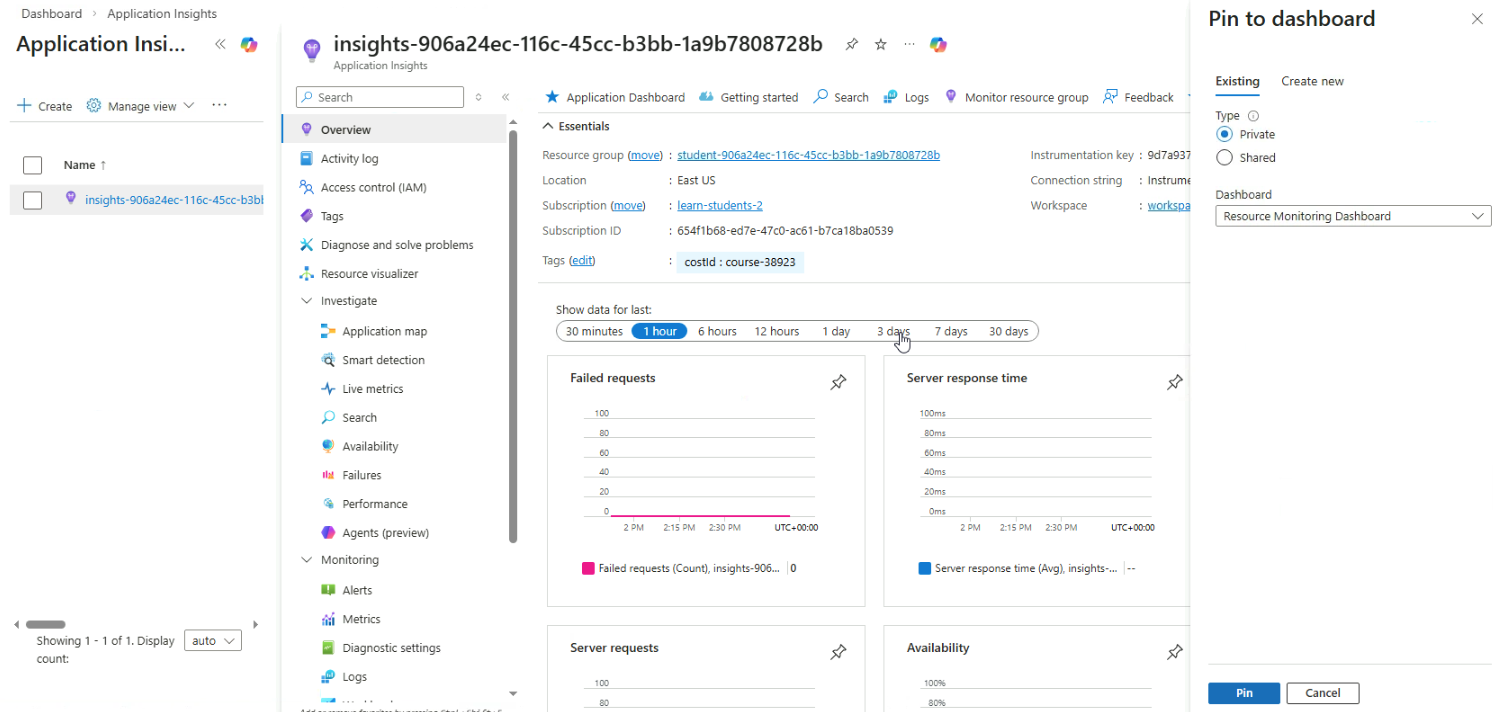
Organize the Dashboard
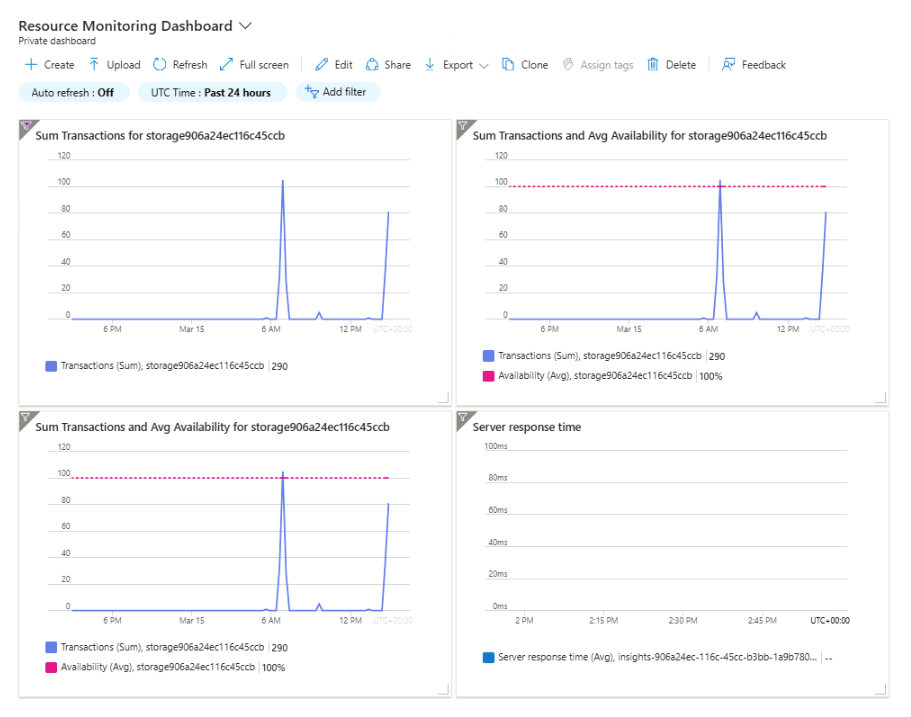
Return to your Resource Monitoring Dashboard and verify that all tiles appear.
- Confirm Storage and Application Insights metrics are visible
- Rearrange and resize tiles for better visibility
- Save the dashboard layout
With these tiles combined, the dashboard provides a unified monitoring view across multiple Azure resources.