Combining Tables
Overview
Data analysis often requires merging multiple files. Instead of writing code, Tableau lets you combine data with drag-and-drop. Two common methods are:
- Unions – Stacking data vertically
- Joins – Linking tables based on relationships
Unions
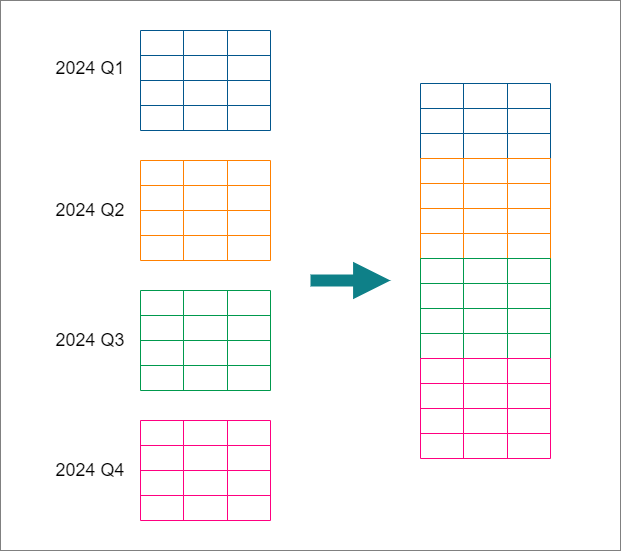
Unions combine data by stacking rows. Useful when data is stored in separate files by time period, like:
- Monthly sales reports
- Quarterly customer data
Example: A company provides trip data in separate quarterly files. To analyze yearly trends, these files can be stacked together as long as they have the same column structure.
Joins
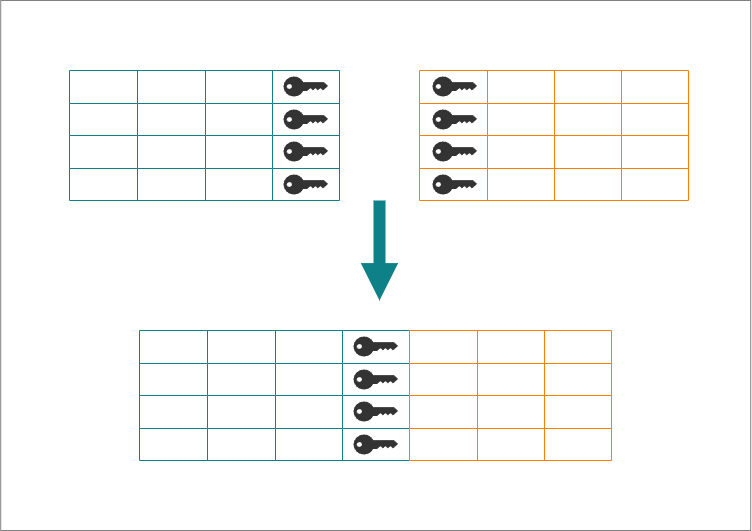
Joins combine tables with related information using a common key. Often used in relational databases to avoid redundancy.
Example: Two tables:
- Employees – Names, department, email, and location ID
- Offices – Location ID and office address
To match employees with their office address, use a join on Location ID as the key. Employees without a matching office get a NULL value.
Types of Joins
Different join types return different results:
- Inner Join – Only matched rows
- Left Join – All left table rows + matched right table rows
- Right Join – All right table rows + matched left table rows
- Full Outer Join – All rows from both tables
Lab: Superstore Dataset
We'll use a fictional Superstore dataset with 7 tables:
- Orders (2016-2020) – Order details (who, what, where, when)
- Returns – IDs of returned orders
- Sales Reps – Sales representatives by region
Using Union
Download the files here:
Problem
- Determine the total row count after merging the 2016 to 2020 sheets.
- Identify the year with the fewest orders in the South Region.
Steps
Load the data:
- Open Tableau Public.
- Click Microsoft Excel to open the file
- The sheets appear under Connections
Create the union by stacking the data from multiple sheets into one table.
- Drag
Orders 2018into the workspace amd double-click it. - Drag
Orders 2019andOrders 2020into "Drag Table to Union". - Right-click ➔ Edit Union ➔ Add
Orders 2016 and 2017one by one.
Since our table now includes multiple years, we should rename it.
- Close Edit Union.
- Right-click the table ➔ Rename ➔ Enter Orders 2016-2020
Now, let’s verify the data in a worksheet.
- Open a new worksheet.
- Under Tables, drag the
Orders 2016-2020to the Text card.
Next, create a new worksheet that displays the order date and region.
- Click the New Worksheet button at the bottom.
- Drag
Profitto Columns. - Drag
Order DateandRegionto rows in that order. - Drag
Regionto Color in the Marks card. - Hover the data for the South region for each year.
Solution
Findings
- There are a total of 11,979 rows after combining the sheets.
- The South region had its least number of orders in 2018.
Using Join
We'll now use joins to add a dataset containing return orders to our worksheet to better analyze customer satisfaction.
Download the files here:
Problem
- Find the region with the most returns from 2016 to 2020.
Steps
Go to the Datasource:
- Double-click Orders 2016-2020.
- Drag
Returnsto the right and drop it. - A join icon will appear. click it and select "Left Join".
- Go to Sheet 1 to ensure the row count remains unchanged.
Create a chart for returned orders:
- In Sheet 1, drag
Order DateandRegionto Rows. - Drag
Orders 2016-2020to Columns. - Set Marks type to "Bar".
- Drag
Returnedto Color in the Marks card. - Right-click the "Null" legend ➔ Edit Alias ➔ Rename to "No".
- Hover over the graph to find the region with the most returns.
Solution
Findings
- The West region has the highest number of orders but also the most returns each year.
Adding a Join
We'll enhance our analysis by adding a dataset with regional sales representatives.
Download the files here:
Problem
- Determine the sales representative who has the least amount of return orders.
Steps
Go back to the Datasource tab to do the second join:
- Double-click Orders 2016-2020.
- Drag
Sales Repsto the right and drop it. - Click the join icon, select "Left Join," and join on "Region."
Create the chart for the returned orders per sales representative:
- Create a new worksheet and rename it Returned Orders by Sales Rep.
- Drag
Orders 2016-2020to Columns andOrder Dateto Rows. - Set Marks type to "Bar".
- Drag
Personto Color in the Marks card. - Drag
Returnedto Filters ➔ Select "Yes" ➔ Click OK. - Click Label in the Marks card ➔ Enable Show Marks Label.
- Change the view from "Standard" to "Entire View".
Solution
Findings
- Cassandra Brandow has the lowest number of return orders